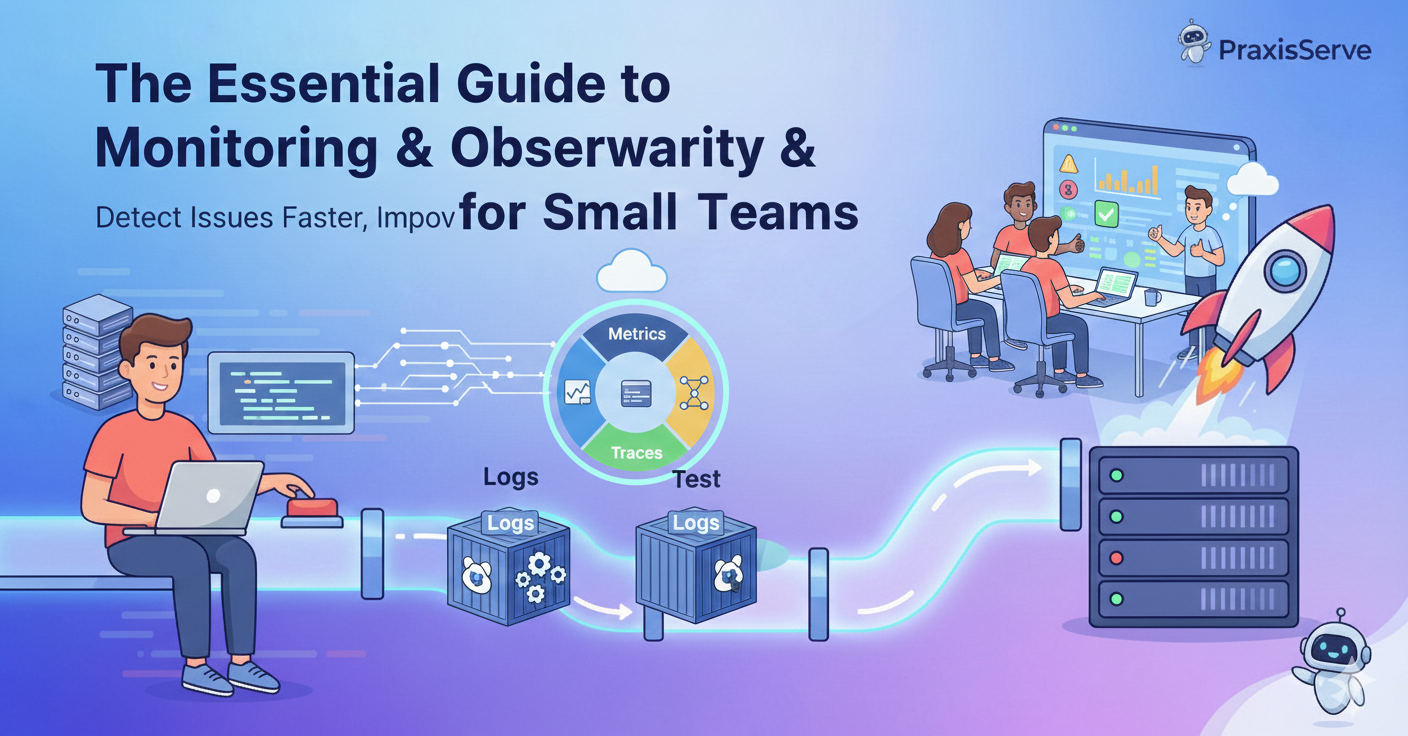
The Essential Guide to Monitoring & Observability for Small Teams

The Essential Guide to Monitoring & Observability for Small Teams
Detect Issues Faster, Improve Performance, and Ensure Client Satisfaction.
As a freelance developer or a small tech team, every minute counts. An unexpected outage, a slow-loading feature, or a hidden bug can not only frustrate users but also damage client trust and your reputation. This is where robust Monitoring and deep Observability become indispensable tools, allowing you to proactively understand and manage the health of your applications and infrastructure.
While often used interchangeably, there's a subtle but crucial difference:
- Monitoring: Knowing your system is working. It's about collecting predefined metrics (CPU usage, network traffic, error rates) to understand what is happening and if your system is meeting expected thresholds. Think of it like checking your car's dashboard for warning lights.
- Observability: Understanding why your system is behaving the way it is. It's about combining metrics, logs, and traces to explore the internal state of your system, allowing you to debug complex issues without redeploying code. Think of it like a mechanic running diagnostics to pinpoint the exact problem.
Key Pillars of Effective Monitoring & Observability
1. Metrics: The What
Metrics are numerical values measured over time. They tell you about resource utilization, performance, and availability. Key metrics to track:
- System Metrics: CPU usage, memory, disk I/O, network traffic.
- Application Metrics: Request rates, error rates, latency, active users.
- Database Metrics: Query response times, connection pools, cache hit ratios.
Tools: Prometheus, Grafana, CloudWatch, Datadog.
2. Logs: The Who, What, When, Where
Logs are timestamped records of events that happen within your application or infrastructure. They provide detailed context for debugging and auditing.
- Centralized Logging: Aggregate logs from all your services into one place for easy searching and analysis.
- Structured Logging: Use JSON or other structured formats for easier parsing and querying.
Tools: ELK Stack (Elasticsearch, Logstash, Kibana), Splunk, Loki.
3. Traces: The Journey
Traces show the end-to-end journey of a request as it flows through various services in a distributed system. They are crucial for understanding latency and pinpointing bottlenecks in microservices architectures.
- Distributed Tracing: Visualize how different services communicate and contribute to overall request time.
Tools: Jaeger, Zipkin, OpenTelemetry.
Implementing a Strategy for Small Teams
You don't need an elaborate enterprise solution. Start simple:
- Prioritize Key Metrics: Identify the 3-5 most critical metrics for your application and infrastructure.
- Set Up Alerts: Configure alerts for abnormal behavior (e.g., CPU > 90% for 5 minutes, error rate spikes).
- Centralize Logs: Even a simple filebeat to a central server can be a huge improvement.
- Regularly Review Dashboards: Don't just set it and forget it. Regularly check your dashboards for trends.
Elevate Your Operational Intelligence with PraxisServe
Are you spending too much time firefighting instead of innovating? PraxisServe helps freelancers and small teams implement effective monitoring and observability solutions tailored to your needs. From setting up dashboards to configuring intelligent alerts, we ensure you have the visibility you need to keep your applications running smoothly and your clients happy.
Need Help with This?
Our team is ready to assist you with implementation and support.